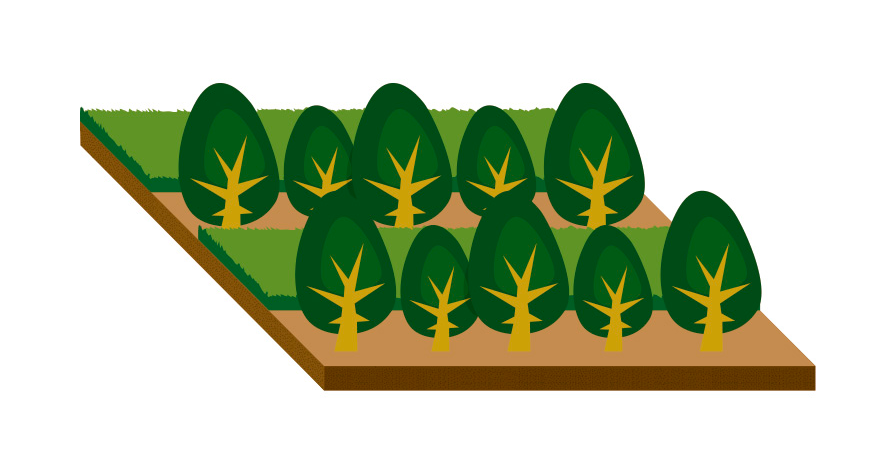
Covering the soil between trees or other perennials protects the soil and reduces erosion from rain and runoff. This is one of the best soil management practices for woody crops, in which at least 30% of the soil surface not covered by canopies of trees should be protected by an inert or living cover.
- Management target
- Sustainability Indicators
DIRECT:
1.- Enhancement of Agro-biodiversity (enhance Habitats for birds; enhance soil fauna; increase fauna over the soil and edaphic fauna; enhance landscape diversity; provide ecosystem services such as pollination of crops, opportunities for recreation, …)
2.- Positive impact on soil structure
3.- Reduction of runoff and erosion
4.- Improvement of water infiltration (micro- and macroporosity) and avoidance of floods and landslides
5.- Avoidance of soil compaction
6.- Enhancement of biomass production
7.- Improvement of water quality
9.- Enhancement of soil fertility (soil productivity)
11.- Impact on the nitrogen cycle (mineral nitrogen is trapped and returned to the following crop; pulses contribute to improvement of organic matter level in soil)
12.- Reduction of GHG levels
INDIRECT:
8.- Increase of soil organic matter
10.- Avoidance of contamination (local and diffuse)
1.- EBITDA
A different soil management will have a clear influence on the economy of the farm.
2.- EBITDA/labour unit
A different soil management will have a clear influence on the economy of the farm.
3.- Production costs
A different soil management will have a clear influence on the economy of the farm.
6.- Feed self-sufficiency
Crop residue management will vary when implementing this BMP (i.e. stubble will not be available for animals).
7.- Effectiveness working time
A different soil management implies less working hours.
8.- SI – Satisfaction Index
The implementation of this BMP could have a positive influence on the farmer’s perception.
9.- Soil Tillage index
Minimum soil disturbance practices and the implementation of permanent cover crops will have a lower grade of aggressiveness on soil.
10.- Annual soil cover rate
Permanent soil cover use will increase the number of days on which the soil is covered.
11.- Organic matter level
Permanent soil cover use will increase organic matter level, due to the soil Carbon sequestration.
12.- Crop biodiversity/rotation
This indicator is directly linked to the surface of cover crops.
13.- NPK balance
The needs and extractions of NPK will change when implementing this BMP (i.e. at the beginning of the implementation of No-Till it can be necessary to increase nitrogen application, because of the higher biological activity).
14.- Energy balance
The energy consumed (mainly) and produced in the farm will change when implementing this BMP.
16.- Water consumption
Due to the reduction of soil disturbance, and the permanent cover crops, soil structure is improved and, hence, its capacity to retain water, too.
18.- Biodiversity surface area
The use of permanent cover crops constitutes areas which are favourable to biodiversity.
21.- Biodiversity structures (nests, hives, spider webs, etc.)- habitats
The use of cover crops in perennials can be a refuge for some species considered in this indicator.
23.- NO3 level – rivers
The risk of contamination in water streams by NO3 is linked to the soil management practices (also depending on the intensity of rainfall or irrigation).
24.- Use of PPPs in some farms close to the water streams
The risk of contamination in water streams by PPPs is linked to the soil management techniques (also depending on the intensity of rainfall or irrigation).
25.- GHG level
The more intensive the tillage, the more exposed to oxidation the soil is and, therefore, to the increase of CO2 emissions. Furthermore, soil tillage implies fuel consumption which increases the production of GHG.

